Data Is the Moat.
The proprietary dataset that compounds with every subscriber, every cycle, every intervention-outcome pair. No competitor can replicate what takes years to accumulate.

Six Data Streams. One Clinical Intelligence.
Every touchpoint in the Mere ecosystem generates structured, clinically relevant data. From the ring on a subscriber's finger to the practitioner's case notes, every signal feeds the intelligence layer. Privacy-first architecture ensures the data serves subscribers, not the other way around.
Pulse Waveforms
Arterial waveform captures every 20 minutes via Mere Pulse. Amplitude, morphology, temporal dynamics, HRV, SpO2, and autonomic balance. Each subscriber generates approximately 72 waveform snapshots per day.
Tongue Imaging
Structured tongue photographs captured through the Mere app during onboarding and monthly check-ins. Color mapping, coating analysis, shape characteristics, sublingual vein patterns. Clinical-grade capture protocol ensures consistency across devices.
Protocol Adherence
Daily intake confirmation, dose timing, missed-dose patterns, protocol switching behavior. Adherence data is the bridge between intervention and outcome, the signal that tells the model whether a formulation had a fair trial.
Outcome Measurements
Self-reported symptom tracking, biometric trend deltas across 30-day cycles, practitioner-recorded observations, and quality-of-life indicators. Structured outcome data paired with specific interventions.
Subscriber Demographics
Age, health goals, prior supplement usage, lifestyle factors, geographic distribution. De-identified demographic data enables cohort analysis and population-level pattern recognition.
Practitioner Observations
Licensed practitioner notes, protocol adjustment rationale, flagged-case reviews, clinical feedback on AI recommendations. The human layer that validates and refines machine-generated insights.
Twenty Years of Clinical Data. Day One.
Most health platforms launch with zero data and hope to accumulate it over time. Mere launches with two decades of clinical records from VUIM and Okchundang, giving NORA AI a foundation that no venture-funded competitor can shortcut.
Clinical tongue images in training corpus
VUIM / Okchundang clinical archive
Synchronized pulse waveform records
Clinical practice, 20+ years
Prescription records from Okchundang history
Intervention-outcome pairs
Expert concordance in clinical pilot
N=200 blinded evaluation
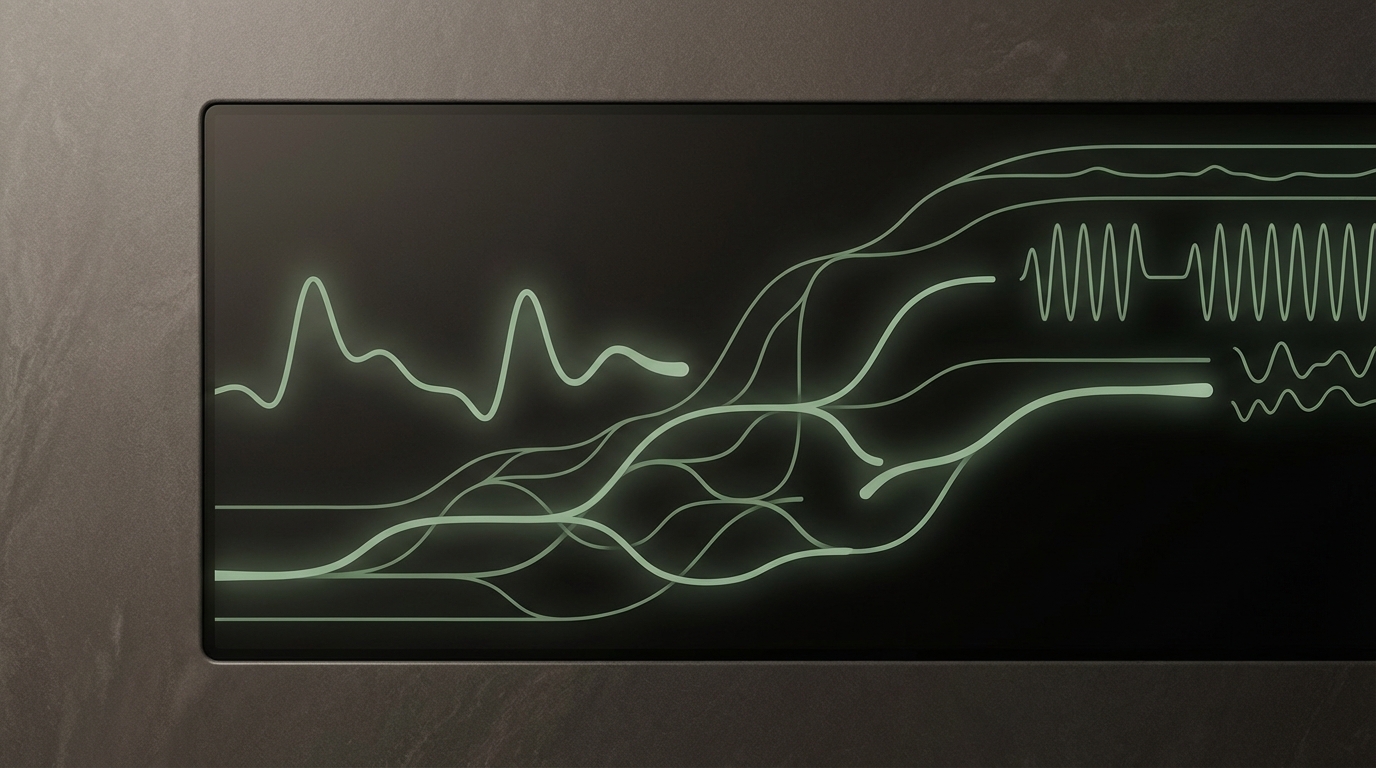
From Raw Signal to Personalized Protocol.
Seven stages transform biometric data into actionable protocol recommendations. Each stage is instrumented, auditable, and designed for continuous improvement as the dataset grows.
Data Ingestion
Raw biometric signals, tongue images, adherence logs, and outcome reports flow into a unified data lake. Every record tagged with subscriber ID, timestamp, protocol version, and practitioner association.
Preprocessing
On-device feature extraction reduces raw waveforms to clinically relevant parameters. Tongue images normalized for lighting, angle, and device variance. Noise filtering, artifact rejection, and quality scoring gate what enters the pipeline.
Dual Encoder Inference
Vision Transformer processes tongue features. 1D-CNN/LSTM processes pulse waveforms. Adaptive attention fusion weights each modality per individual, per organ system, per assessment.
Trend Index Generation
Organ-function trend indices produced in under 5 seconds. Longitudinal comparison against subscriber baseline and population norms. Directional signals, not diagnoses.
Protocol Recommendation
Trend indices map to protocol adjustments. The recommendation engine draws on 3.1 million prescription records to identify formulations that address the detected patterns. Practitioner review for flagged cases.
Outcome Measurement
Next-cycle biometric data compared against pre-intervention baseline. Did the protocol produce measurable change? Outcome data closes the loop and feeds the next recommendation.
Model Retraining
Accumulated intervention-outcome pairs improve the model over time. Every subscriber cycle generates training data. The more cycles completed, the more accurate the next recommendation.
Three Dashboards. Three Audiences.
Data is only valuable when it reaches the right person in the right format. Mere surfaces intelligence across three distinct interfaces, each designed for its audience's workflow and decision-making context.
Practitioner Dashboard
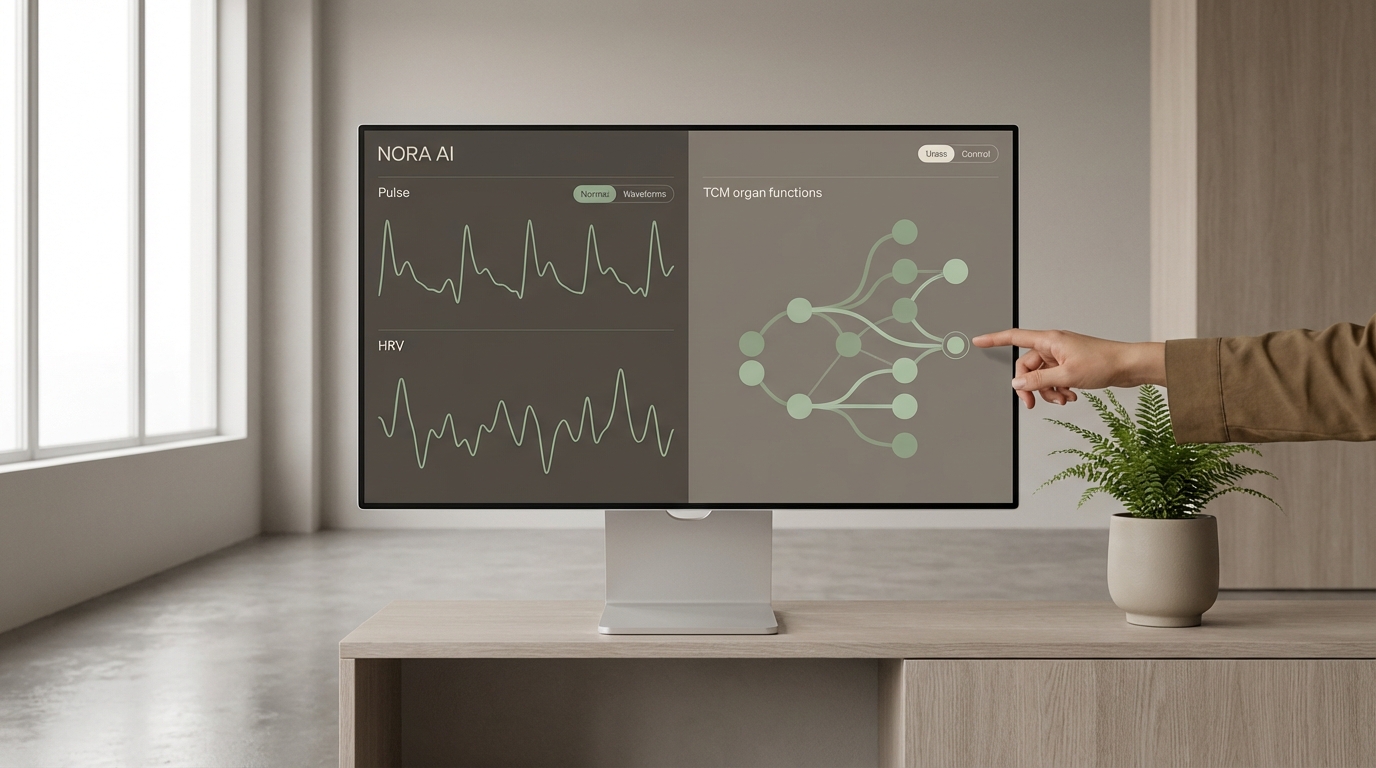
Patient panel management, aggregate biometric trends across patient base, protocol efficacy heat maps, flagged-case queue, and intervention outcome tracking. Designed for clinical workflow, not consumer curiosity.
Subscriber App
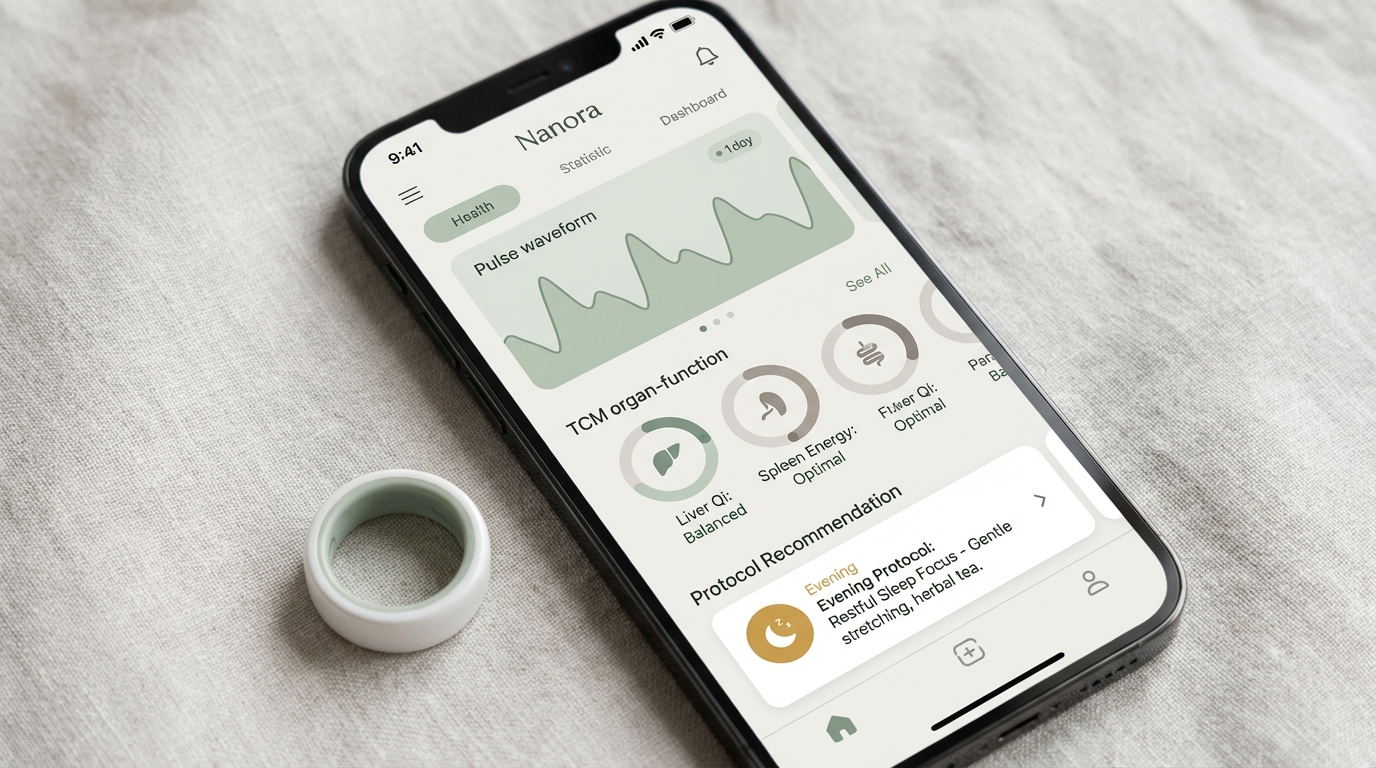
Personal biometric trends over time, protocol adherence visualization, outcome progress against goals, monthly health report cards. Information architecture that keeps subscribers engaged without overwhelming them.
Internal Analytics
Cohort analysis by protocol type, demographics, adherence level, and practitioner. Retention driver identification. Protocol performance benchmarking. Revenue attribution by channel and practitioner network.
The Dataset No One Else Has.
Anonymized outcomes data linking TCM interventions to biomarker changes. Academic research partnerships. Pharmaceutical clinical trial support. The dataset that connects herbal protocols to measurable physiological outcomes has no equivalent in the market.
Academic Research
Anonymized outcomes data available to university research programs studying TCM efficacy. Published research amplifies credibility and drives practitioner adoption.
Pharma Partnerships
Clinical trial support leveraging intervention-linked biomarker datasets. Pharma companies seeking natural compound efficacy data have no comparable source.
Licensing Revenue
De-identified, aggregated dataset licensing as a standalone revenue stream. Data platform economics layered on top of subscription and hardware revenue.
The Data Platform Inside the Wellness Company.
Oura's data drives 20% of revenue from subscriptions. But Oura's data is passive monitoring. Mere's data is intervention-linked, connecting specific protocols to specific biometric outcomes. That linkage is categorically more valuable than passive tracking, and it compounds with every subscriber cycle.
Standalone Data Value
The intervention-linked dataset is independently valuable as a licensable asset. Even without hardware or supplements, the data platform sustains premium valuation multiples.
Defensibility Multiplier
Data moats compound over time. Every subscriber-month increases the barrier to replication. The longer Mere operates, the wider the competitive gap becomes.
Multiple Revenue Streams
Subscriptions, hardware, data licensing, research partnerships. Four distinct revenue vectors from a single integrated platform.